Are Time-Of-Use Rates Good For Solar?

How time-of-use rates affect net metered solar customers
It seems like every utility these days is jumping on the time-of-use bandwagon. If you’re in California, all the big privately-owned utilities offer time-of-use rates (often referred to as TOU rates) including PG&E, SDG&E, and SCE.
In fact, in 2016, California passed regulations that all future net-metered solar customers must move to time-of-use rates. If you live in another state, there are simply too many utilities to list that offer these rates.
With prices changing based on the time of day as well as the season, time-of-use rates can sometimes get confusing. And with these fluctuating changes, how do you know how much you’re spending, or saving, on electricity? Beyond that, what is ‘peak time’ or ‘peak season?’ Why do prices even change? Why can’t we just pay one set amount for electricity?
If you’ve got solar installed, it’s even more complicated. What if your solar installation puts energy into the grid at peak period when electricity is expensive, but you pull from the grid during lower-priced times, are you compensated correctly? How is your excess generation calculated?
Today, we’re going to answer all these questions by showing you how TOU rates affect solar savings and what you can do to increase your savings as much as possible!
What are Time-of-Use rates?
We’ve already mentioned what TOU rates are, but let’s outline a bit more clearly how TOU rates work before we go any further.
In the past, most utilities charged a set price for each kilowatt-hour (kWh) of electricity you purchased. Your utility will charge something like $0.13 per kWh no matter what time of day or season. This ‘standard’ approach is a simple, easy system. But it has a flaw.
The majority of us are on similar schedules. At night, we sleep. During the day, we’re at work. In the evening, we go home. You can actually see this pattern in our electricity use, which spikes in the morning as we prepare to go to work and at night, as we lounge around the house and do chores.
Utilities use several different types of power plants to meet these energy demands. For most of the day, they can use plants that are cheaper to run but are slow to turn on or off.
When demand shoots up in the morning and evening, they need to quickly produce more electricity to meet increased demand. To do this, they have special ‘peaker plants’ that they can quickly turn on. While very convenient, these peaker plants can be more expensive to run and therefore produce electricity that is more costly.
If you’re on a ‘standard’ rate, it doesn’t matter when you use electricity, what the demand is, or where it comes from – you pay one single price.
With TOU rates, though, as demand increases and your utility switches on those peaker plants, your per-kWh rate increases. If demand is low and they can cover demand with cheaper electricity, your per-kWh price is lower. TOU rates are actually designed to encourage you to use less electricity when it is more expensive to generate.
For those of us that don’t mind changing our lifestyle a bit, TOU rates offer a great way to save money on electricity. Instead of washing your clothes at 8 PM when demand is high, do it in the morning when prices are lower. Put your dishwasher on a delay for 4 hours until after prices go back down.
And these savings aren’t just theoretical, either. Arizona’s SRP claims customers see an average of 6% annual savings after moving to TOU rates, and the Wake Electric Coop in North Carolina claims you can save up to 25%.
Of course, with TOU rates giving the power back to you, it’s a double-edged sword. If you don’t change your habits, you’ll actually end up spending more money than you would with a ‘standard’ rate.
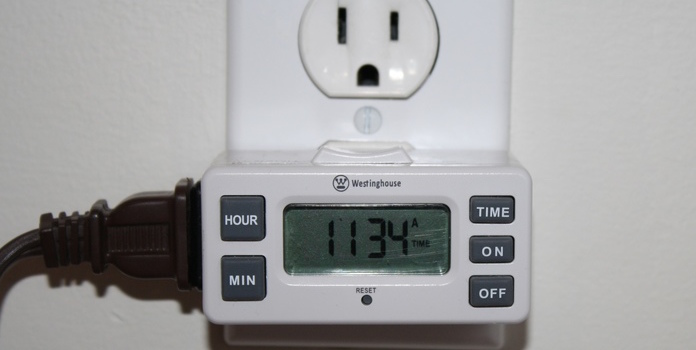
If you want to save money, TOU rates require you to become more engaged in your own electricity use. This might sound a little daunting at first, but it’s really not that difficult. Before you switch on an energy-hogging device, you just need to ask yourself, “What time is it?” If it’s during peak hours, wait a little bit to flip the switch. Or better yet, just put it on a cheap timer and forget about it.
If TOU rates seem strange to you, think about this: have you ever enjoyed low-price matinee tickets? How about the happy hour at your local pub? My guess is probably yes.
If you have, you’re already familiar with TOU rates! When demand is lower (i.e. the middle of the day), prices are lower too. You take advantage of this when you go out to eat or see a movie. Now it’s time to apply that mindset to your electricity use as well!
PG&E Time-of-Use rates
Before we move on to how solar works with TOU rates, let’s take a look at PG&E time-of-use rates to get a clearer understanding of how they work. We actually published an article on this topic, PG&E Tiers and California’s New Net Metering Rates, so check it out if you want to go even deeper!
PG&E charges more or less depending on the time of day as well as the season since electricity is in higher demand during the hot summer. Here’s how their prices break down:
| Season | Off-Peak or On-Peak? | Cost |
| Summer (June–Sep) | On-Peak (3 PM to 8 PM weekdays) | $0.36 per kWh* |
| Off-Peak (all other times) | $0.25 per kWh | |
| Winter (Oct-May) | On-Peak (3 PM to 8 PM weekdays) | $0.22 per kWh |
| Off-Peak (all other times) | $0.20 per kWh |
You can see that on-peak pricing in the summer is about 50% higher than off-peak pricing(*)! If you can wash your dishes and take your nightly shower (if you have an electric water heater) after 8 PM, you stand to save quite a bit on your electricity bill!
During the wintertime, when electricity sees lower demand, on-peak and off-peak pricing are much closer in cost, though on-peak is still about 10% higher!
Like we said before, with TOU rates you – not the utility – are in control of how much you spend on electricity. Pretty cool, huh?
Let’s take a look at one more example before moving forward.
SRP Time-of-Use rates
Let’s take a look at Arizona’s SRP, one of the largest utilities in the US, to see what their TOU rates are like. Similar to PG&E, SRP time-of-use rates are structured by time and season.
| Season | Off-Peak or On-Peak? | Cost |
| Spring, Fall (May-June, Sep-Oct) | On-Peak (1-8 PM) | $0.194 per kWh |
| Off-Peak (all other times) | $0.071 per kWh | |
| Summer Peak (July-Aug) | On-Peak (1-8 PM) | $0.221 per kWh* |
| Off-Peak (all other times) | $0.072 per kWh | |
| Winter (Nov – April) | On-Peak (5-9 AM, 5-9 PM) | $0.101 per kWh |
| Off-Peak (all other times) | $0.070 per kWh |
SRP is a bit different than PG&E, as they actually break down the year into 3 seasons to separate out the ‘Summer Peak’, a time when electricity is in ultimate demand, the hottest part of the year when everyone’s got their AC on full blast!
Look closely and you’ll see that on-peak electricity during the Summer Peak period costs more than 3x as much as off-peak(*)! You can also see that on-peak pricing is from 1 PM to 8 PM during the summer – quite a long time. But if you can hold off of your chores until after 8 PM, you can save a lot!
In the wintertime, the chasm between on- and off-peak pricing isn’t as wide, but still great enough to warrant consideration.
If you’re a homeowner with a net-metered solar installation, SRP doesn’t actually charge TOU rates. They go one step further and charge what’s known as ‘demand rates’. Utilities across the country commonly use demand rates for commercial customers, but they’re extremely rare for residential customers.
Under a demand rate, customers are charged a fee based on their absolute highest amount of electricity they pull in a single instant during the peak period. Demand fees change according to the season. SRP charges customers $68 if they pull 5kW of electricity during Summer Peak (July & August), $56 during the summer period, and $22 during the winter.
Again, demand fees aren’t based on how much electricity you use over the course of the month, but how much you pull in a single instant. Consider this: with a ‘standard’ or TOU rate, if you left a 10 watt LED light bulb on for a full month, you’d be charged for 7.2 kilowatt-hours of electricity (10watts X
Standard Rate:
With a demand rate, your fees are based on that 10 watts of demand, not the 7.2 kWh you used. Demand charges cover the cost your utility incurs to ramp up their electricity production to meet that 10 watts.
Remember those expensive peaker plants that utilities turn on when demand is high? SRP is trying to encourage you to shift your electricity use to other times of the day so they don’t have to use those expensive plants as frequently.
Demand charges have the same basic goal of TOU rates, but go about it in a slightly different manner.
Are TOU rates good for solar?

We now know that TOU rates are a great way to save money – just microwave that burrito after 8 PM and you’re already saving some cash!
Now let’s throw solar into the mix. Specifically, let’s throw a net metered solar installation into the mix. Do TOU rates and solar go together? You bet! As we already mentioned, the state of California will soon require all net metered solar customers to join a TOU rate – a good sign.
If your solar installation is net metered (and it probably is), over the course of each month, your utility watches how much electricity your solar installation adds to the grid (when you’re not home to use it) and how much you take from the grid (when your installation isn’t producing any electricity). At the end of the month, your utility credits your account for any excess electricity you produced.
For example: last month you produced 950 kWh of electricity, but you only used 850 kWh. You therefore produced 100 kWh of excess electricity that went into the grid to be used elsewhere. Your utility will credit your account for that 100 kWh.
This simple example is accurate if you’re on a ‘standard’ rate, but what if you’re on a TOU rate? Well, there’s good news!
If you’re a net metered solar homeowner on a TOU rate, the credits you receive are based on electricity prices when each kilowatt-hour you produce goes into the grid. If you produce 10 kWh that goes into the grid during peak demand, you’re credited at that on-peak rate for those 10 kWh. Here’s a quote from the California Public Utilities Commission describing this system:
Bill credits for the excess generation are applied to a customer’s bill at the same retail rate (including generation, distribution, and transmission components) that the customer would have paid for energy consumption according to their otherwise applicable rate structure.”
This is actually really cool if you play your cards right, as you can squeeze even more financial savings from your solar installation thanks to your TOU rate.
How so? Let’s paint a picture. Like most of us, you go to work from 9 AM to 5 PM. During the day, your solar installation is producing electricity that you can’t use because you are not home. If you’re a PG&E customer, the utility credits all the solar electricity your installation produces after 3 PM, when on-peak pricing begins, at that higher rate.
You get home at 6 PM and hold off using electricity for the rest of the on-peak hours. Finally, 8 PM rolls around, signaling off-peak pricing, and you crank up your AC, throw your clothes in the wash, and watch some TV.
With this simple schedule, your solar installation has credited your account with expensive on-peak electricity, but you’ve only used electricity during low-cost off-peak pricing. You know the old Wall Street saying “Buy low, sell high,” right? Well, that’s what you just did! Thanks to your solar installation and some easy behavior changes, you’ve now got quite a bit of credit to pull from on a rainy day!
Example: TOU rates with a solar installation

Hopefully, now you can see just how beneficial time-of-use rates can be when paired with solar. To finish up this article, let’s run through an example, using PG&E since we’re already familiar with their TOU rates (though of course, this can be applied to any similar TOU rate).
Let’s say during July, your solar installation produced about 20 kWh each day, or about 600 kWh per month (typical for a 5kW installation in San Francisco). Your solar production will be highest from around 10 AM to 3 PM (take a look at this graph from EIA) when the sun is highest in the sky, so let’s just guesstimate and say that about 15% of all your solar electricity is produced after 3 PM, during on-peak hours (your actual energy production will vary of course).
At this rate, you’ve produced:
- 17 kWh during off-peak pricing and 3 kWh during on-peak each day, or
- 510 kWh a month during off-peak pricing, 90 kWh during on-peak
Let’s keep this simple and say that all the electricity you produced went directly into the grid. At the end of the month, your bill credits would equal $160. Not too bad!
Bill credits:
Now let’s say you actually purchased 700 kWh (or about 23 kWh a day) during that same month from the utility (FYI, 700 kWh is actually a bit higher than the state average). Just for fun, let’s pretend you don’t care a lick about your TOU rate and use about 80% of your electricity during on-peak pricing:
20% of 700 kWh during off-peak: $35
This makes a grand total of $237, for a grand total monthly bill of $77 after accounting for your net metering.
Total:
That’s pretty good, but now let’s make this more interesting and say you are very cognizant of your TOU rates and are able to shift your energy use so that 50% is during off-peak hours. Let’s see how this affects your solar savings:
50% of 700 kWh during off-peak: $87.50
Add it up and you’re paying $214 for electricity and just $54 after accounting for net metering. That’s a $20 drop in your monthly bill, just by moving around your energy use!
Total:
Of course, don’t get drawn into the specifics of this example too much. We assumed too much for it to be useful beyond simply pointing out how solar and TOU rates can work together. We can’t know how much of your energy use you can move to off-peak hours or exactly how much electricity your installation will produce at certain times of the day. For that, you need to talk to a local installer that is familiar with your utility’s rates.
However, this example and the information above show how you can use net metering and TOU rates to your own benefit, allowing you to save even more money than you’d be able to with solar on just a ‘standard’ rate. Of course, if you don’t change your habits, you can actually end up spending more money, as many homeowners on SRP’s demand rate found.
For better or for worse, TOU rates give you the power to decide how much you want to spend on electricity. It’s up to you to choose what you want to do. Just remember – think before you flip that switch!
We also have other articles to reduce your power bill even further, have a look at energy saving curtains, how to reduce energy costs, and for the winter – the most efficient electric heater.